45 People In Massachusetts Killed In Teen Crashes Over “100 Deadliest Days”
Some sobering statistics were released today about deadly crashes involving teenagers in Massachusetts and in the nation as a whole over the past 10 years. The numbers are staggering when you consider just how many families have been affected by these senseless tragedies that probably could have been avoided in many cases.
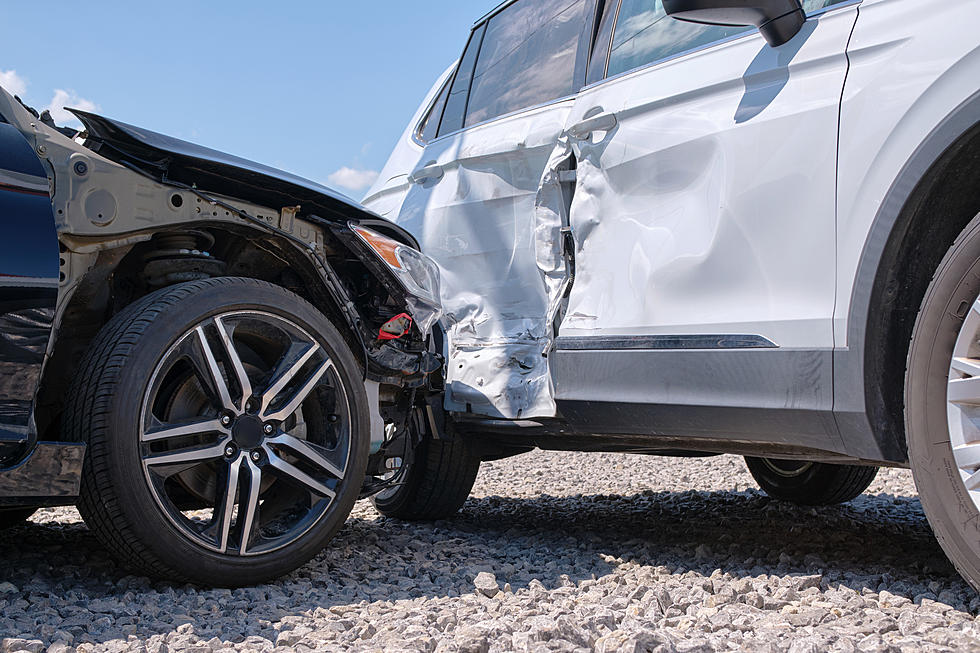
45 people were killed in Massachusetts over the 100 Deadliest Days...
The statistics released by AAA Northeast today highlight 10 years of fatal crashes from 2011 to 2020. The AAA study says that, in Massachusetts, 45 people were killed in crashes in which teenagers were behind the wheel over what is being referred to as the “100 Deadliest Days” - the summer months between the years 2011 and 2020. In fact, AAA says that 35 percent of the fatalities involving teens occurred during the summer months of those years.
More than 7,000 were killed in teen-related crashes across the nation...
The numbers across the country are even more staggering. AAA says that 7,124 people have died over that same 100-day period at the hands of teenage drivers. The study concluded also that the number of these deaths is directly correlated to the amount of free time that teenagers, who may be newer drivers, have to drive and socialize because they are on break from school.

There are more daily deaths in crashes involving teen drivers during the summer months than the rest of the year because teens tend to have more unstructured time behind the wheel. ~ Mary Maguire, Director of Public and Government Affairs at AAA Northeast
It seems obvious, but teenagers need to have a clear understanding of the rules of the road before they are allowed to drive on their own - and they certainly need to be able to follow guidelines for safe driving.
AAA has a very good educational video on its YouTube page. Here is that Video:
LOOK: See how much gasoline cost the year you started driving
Gallery Credit: Sophia Crisafulli
See the Must-Drive Roads in Every State
Gallery Credit: Sarah Jones
KEEP READING: Here are the best places to retire in America
More From WUPE