Report Looks At Nation’s Worst Roads. How Bad Is Massachusetts?
Have you ever been driving around and maybe you weren't paying full attention, misjudged the size of a pothole, and next thing you know, your vehicle has been swallowed up by a huge gaping maw in the ground?
Okay, maybe I'm exaggerating a little, but let's face it--roads are in pretty bad condition almost everywhere. How bad are they in the Bay State? According to a new study, the roads in Massachusetts are some of the worst in the nation.

ConsumerAffairs.com recently did a study looking at road conditions from the past year state by state, and guess what? Two states in New England made the top 5 for having the worst roads in the nation.
According to ConsumerAffairs.com, Rhode Island came in at #1! Coming in at #5? Massachusetts! That means out of 50 states, 45 of them have better roads than we do. That number, at least to me, is mind-boggling.
Data were analyzed from email surveys and government reports and scores were calculated based on pavement roughness, how much each state spends on maintenance, and highway safety.
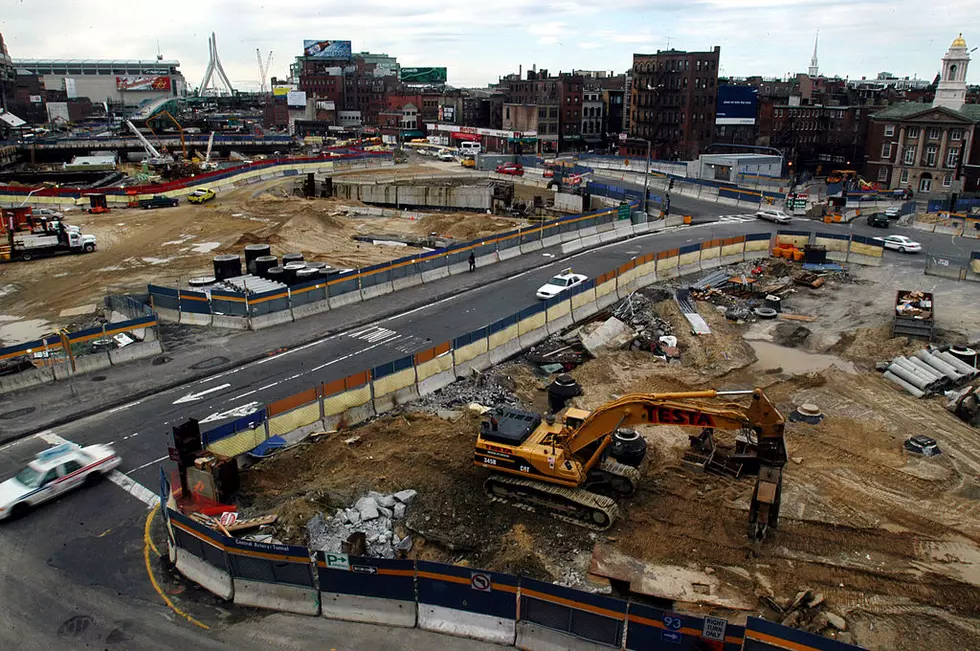
Also, according to the report, Massachusetts has 472 bridges and nearly 1,200 miles of highway that are in poor condition. In the survey, many Massachusetts residents complained about the high number of potholes as a result of harsh winters.
It's not all bad for New Englanders. It turns out that Vermont and New Hampshire have some of the best roadways in the nation. Rounding out the top 5, Hawaii came in at #2, Wisconsin at #3, and California was ranked #4 for worst roads.
The top 5 states for best roads? Kansas is first, followed by Alabama, North Dakota, Kentucky, and Florida. For more on the study and to see where each state is placed on the list, visit ConsumerAffairs.com's website here.
See the Must-Drive Roads in Every State
LOOK: See how much gasoline cost the year you started driving
Gallery Credit: Sophia Crisafulli
How Many in America: From Guns to Ghost Towns
Gallery Credit: RACHEL CAVANAUGH
LOOK: Things from the year you were born that don't exist anymore
Gallery Credit: Stacey Marcus
More From WUPE